Ever built something with LLMs? It’s exciting, right? But let’s be real, they’re not like traditional software. LLMs can be unpredictable – think hallucinations, inconsistent answers, slowdowns, or sneaky high costs. When things go sideways, a few print statements just won’t cut it. You need to see what’s really going on under the hood.
That’s where LLM observability shines. It’s all about getting a crystal-clear, end-to-end view of your AI app’s behavior in the real world. In this guide, I’ll break down what LLM observability is, why you absolutely need it, and how to set up your own powerful monitoring system using Langfuse and vLLM, right on your machine.
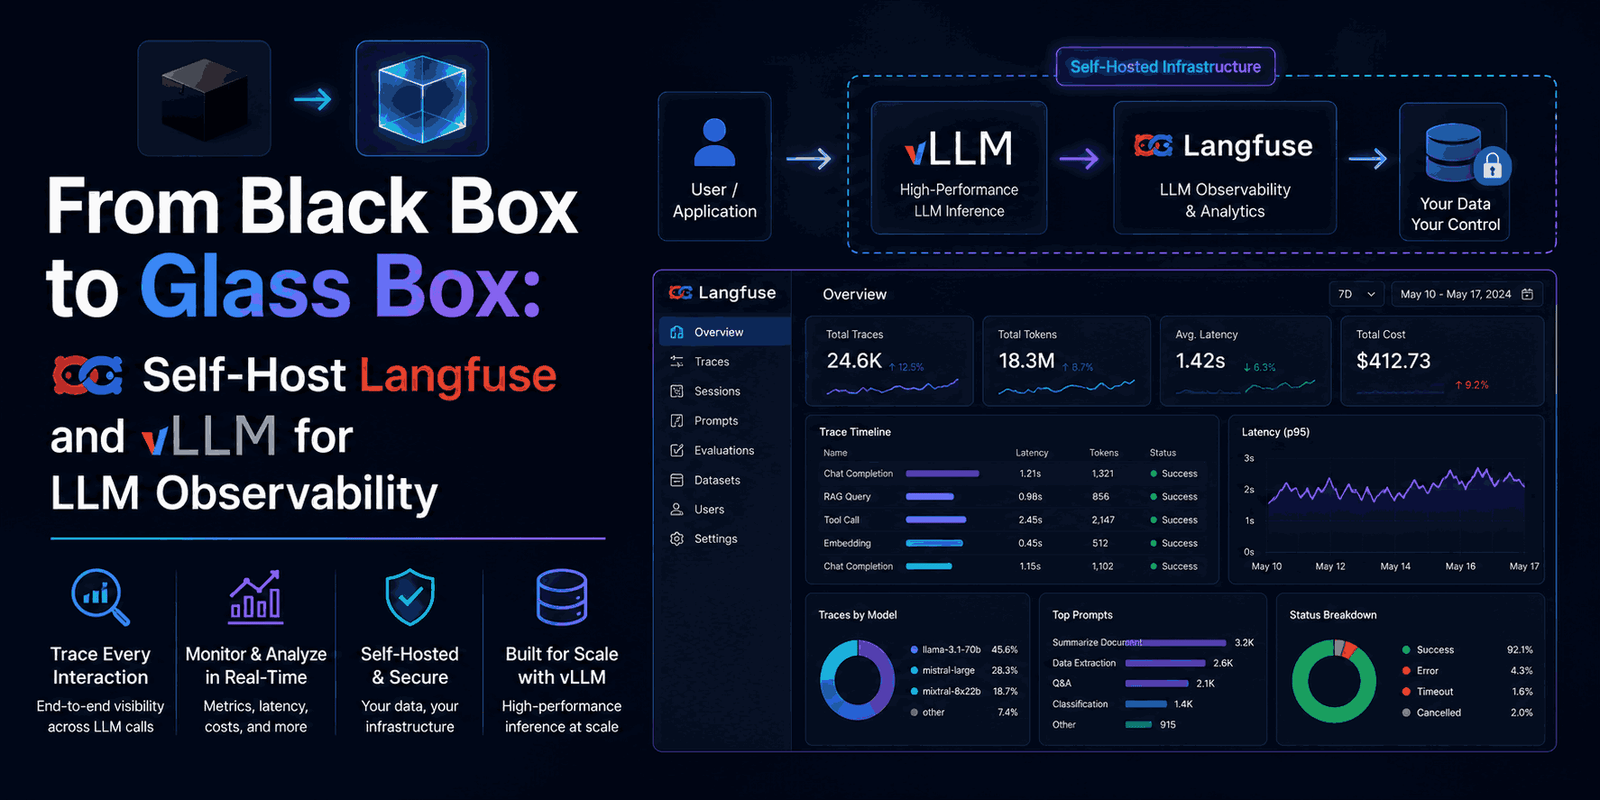
By the time we’re done, you’ll be tracing every prompt, measuring latency, tracking token usage, and debugging your LLM workflows like a pro. Say goodbye to the mysterious “black box” and hello to a transparent, debuggable AI system.
Why Modern LLM Applications Need Observability
LLMs add a whole new layer of complexity to software. Their probabilistic nature means debugging isn’t just about finding a simple coding error. Traditional debugging tools often miss the mark, which is why specialized LLM observability is a game-changer.
The Unique Challenges of LLM Operations
- Unpredictable Outputs: Same input, different answer? LLMs can be inconsistent, making reliable output a challenge.
- Hallucinations: They confidently make stuff up that isn’t true.
- Performance Bottlenecks: Watch out for latency spikes from server issues, tokenization, or complex multi-step processes.
- Cost Management: Tokens = $$$. Without tracking, costs can easily explode.
- Silent Failures: Overflowing context windows or subtle multi-step failures can hurt user experience without a clear error message.
Without good observability, you’re just guessing. You won’t have the data to understand why your LLM did what it did.
Beyond Logs and Metrics: The Power of Traces
Modern software monitoring relies on three pillars:
- Logs: Basic text messages. Good for quick errors, but a pain for understanding complex LLM conversations.
- Metrics: Numbers over time (like requests per second, average latency). Great for dashboards and alerts, but they won’t tell you exactly what happened during one specific request.
- Traces: These are the superstars. Traces show the full, structured journey of a single request through your whole system. This is where LLM observability truly shines.
For LLM apps, traces are absolutely vital. A single user question could involve multiple model calls, retrieval-augmented generation (RAG) steps, embeddings, or complex agent logic. Traces give you a clear, step-by-step view, so you can pinpoint problems fast. They show you:
- The exact prompt and system messages.
- The LLM’s complete output.
- Latency for every single sub-step.
- Input and output tokens – key for costs and speed.
- Where hallucinations might be happening, or where contexts are failing.
- How multi-step pipelines are flowing and if they’re correct.
Think of it this way: logs tell you what happened, metrics tell you how often, but traces? Traces tell you why.
Introducing Langfuse: Your LLM Observability Solution
Let me introduce you to Langfuse. It’s an open-source observability platform built just for LLM applications. It helps developers capture and visualize all the crucial data from their LLM workflows, giving you a full picture of how things are performing and behaving.
Langfuse captures:
- Traces and Spans: Think of these as hierarchical records of your whole LLM pipeline and its individual steps.
- Prompt Metadata: Details like inputs, parameters, and system messages.
- Inputs and Outputs: The entire conversation and the LLM’s responses.
- Token Usage: Super important for managing costs and model efficiency.
- Latencies: How long each part of your pipeline takes.
- Scores: Custom metrics to evaluate output quality, correctness, and safety (we’ll cover this more later!).
Langfuse then presents all this in a clean, developer-friendly UI. You can easily inspect and analyze your LLM interactions there. It’s like your personal control panel for understanding and tweaking your AI applications.
Now, while tools like MLflow or Weights & Biases are awesome for model training and tracking experiments, Langfuse really shines during the inference stage – that’s when your LLM application is actually running. This is where those unique LLM challenges truly pop up.
Building a Self-Hosted LLM Observability Stack
For real-time insights and full control over your data, self-hosting Langfuse is often the way to go, especially during development. Cloud solutions can sometimes add delays or inconsistencies, which is super frustrating when you’re trying to debug an agent or RAG system.
Our setup combines Langfuse with vLLM, a high-performance LLM inference engine, all running locally with Docker Compose.
Key Components of Our Stack
Here are the main services we’ll be using:
- Your Python LLM Application: Your main code, sending prompts to the LLM.
- Langfuse SDK: Hooks into your Python code, recording all observability data (traces, spans, inputs, outputs, tokens, etc.).
- vLLM Server (Port 8000): Our local LLM inference engine. It hosts the actual LLM (like Llama 2) and offers an OpenAI-compatible API for your app.
- Langfuse Server (Port 3000): The brain of your observability platform. It gets trace data from the Langfuse SDK and hosts the Langfuse UI.
- Langfuse Worker: Don’t forget this one! It’s crucial for the dashboard to work. It processes raw trace data, creates analytics, updates charts, and handles background tasks. Without it, you’d see traces, but your dashboards would be blank.
- PostgreSQL Database: Where all your Langfuse traces, spans, metadata, and scores are stored permanently.
This architecture makes sure every LLM call is captured as a structured trace, giving you detailed info you can dive into immediately.
How Data Flows Through the System
Let’s see how a single LLM request travels through the system:
- Your Python script sends a request to the
vLLMserver. - At the same time, the
Langfuse SDKin your script grabs details (like the prompt and parameters) and sends this trace info to theLangfuse Server. - The
Langfuse Serversaves this raw trace data to thePostgreSQLdatabase. - Next, the
Langfuse Workerprocesses this raw data, creating the aggregated analytics, span trees, and other visuals for your dashboard. - Finally, the
Langfuse Web UIdisplays all this processed data – trace trees, input/output, token usage, and latency heatmaps – in real-time.
Knowing this flow helps immensely when you’re troubleshooting or navigating the Langfuse dashboard. It’s how your prompt transforms into a visible, debuggable record in your observability platform.
Setting Up Your Self-Hosted Langfuse and vLLM Environment
Before we jump into instrumenting our LLM calls, let’s get our local development environment squared away. This means setting up our project, installing dependencies, configuring environment variables, and firing up our core services with Docker Compose.
Project Structure
A tidy project makes managing your LLM app and its observability components much simpler. Here’s a typical setup:
configs/: Holds global settings likeconfig.yamlfor LLM parameters and Langfuse.src/: Where your Python scripts, utility functions (for LLM client and config loading), and tracing examples live.docker-compose.yml: Defines all the services for your self-hosted stack (Langfuse, vLLM, PostgreSQL).requirements.txt: Lists your Python dependencies..env: Stores sensitive environment variables like API keys and host URLs.
Installing Python Dependencies
First, install the Python packages you’ll need:
pip install -r requirements.txt
You’ll need langfuse (for the SDK), openai (since vLLM offers an OpenAI-compatible API), python-dotenv (to load environment variables), and pyyaml (for config files).
Configuring Environment Variables
Copy the example environment file and fill in your specific details:
cp .env.example .env
You’ll need to set these:
LANGFUSE_PUBLIC_KEYandLANGFUSE_SECRET_KEY: You’ll get these from your local Langfuse dashboard once it’s up.LANGFUSE_HOST: For local development, this is typicallyhttp://localhost:3000.OPENAI_BASE_URL: This should point to your localvLLMserver, e.g.,http://localhost:8000/v1.OPENAI_API_KEY:vLLMdoesn’t need auth, so “dummy” works perfectly here.
This .env file keeps all your connection details in one place, making your code cleaner and easier to adapt.
Centralized Configuration with config.yaml
Instead of hardcoding, we’ll use a YAML file (configs/config.yaml) for LLM settings and Langfuse project details:
llm:
  base_url: "http://localhost:8000/v1"
  model: "meta-llama/Llama-2-7b-chat-hf"
  temperature: 0.7
  max_tokens: 300

langfuse:
  host: "http://localhost:3000"
  project_name: "llm-observability-selfhosted"
This way, you can easily swap models, tweak generation parameters, or change Langfuse settings without touching your main application code. Utility modules like src/config.py and src/llm_utils.py will load these settings and provide a consistent vLLM client for your scripts.
Deploying with Docker Compose
The docker-compose.yml file brings together all the services for your observability stack:
- Langfuse Server: Handles the UI and API, running on port
3000. - Langfuse Worker: Processes trace data for your dashboards.
- PostgreSQL: The database for Langfuse, using port
5433(to sidestep common port conflicts). - vLLM Model Server: Your local LLM inference engine, usually running
Llama 2by default, accessible on port8000.
To kick everything off (with GPU acceleration if you have it):
docker compose --profile gpu up -d
Or for CPU-only machines:
docker compose --profile cpu up -d
Check that all services are running smoothly with docker compose ps. Once they’re up, head over to http://localhost:3000 in your browser to see the Langfuse dashboard. Create a new project, grab those public and secret keys, and pop them into your .env file. Then you’re all set to restart your application scripts.
Baseline LLM Application: Before Observability
Before we dive into Langfuse, let’s check out a simple LLM application without any observability features. This “baseline” script will really show you what you’re missing when you’re debugging blind.
Picture a basic Python script: it connects to your local vLLM server, asks a question, and prints the answer.
# src/basic_llm_app.py
from llm_utils import get_llm_client
from config import get_llm_config

client, model = get_llm_client(load_model_from_config=True)

def generate_answer(question: str) -> str:
    """Generate answer using vLLM - NO tracing."""
    llm_config = get_llm_config()
    response = client.chat.completions.create(
        model=model,
        messages=[
            {"role": "system", "content": "You are a helpful assistant."},
            {"role": "user", "content": question}
        ],
        temperature=llm_config.get("temperature", 0.7),
        max_tokens=llm_config.get("max_tokens", 300)
    )
    return response.choices[0].message.content

def run_simple_pipeline(question: str):
    """Simple pipeline without tracing - baseline example."""
    print(f"\nQuestion: {question}")
    print("Generating answer (no tracing)...")
    answer = generate_answer(question)
    print(f"✅ Answer:\n{answer}\n")

if __name__ == "__main__":
    question = "What is machine learning?"
    run_simple_pipeline(question)
This script will happily query your vLLM server and give you an answer. But if you run it, all you’ll see in your terminal is the question and the final response.
What you won’t see:
- How long did
vLLMtake to reply? - How many tokens were used (input vs. output)?
- What exact model parameters were used for this call?
- If there was an error, which prompt broke it?
- How does this run compare to previous ones?
This baseline really drives home the gap that LLM observability fills. For any serious AI application, this “black box” approach just isn’t enough for debugging, tuning performance, or managing costs.
Adding LLM Observability with the Langfuse @observe Decorator
Okay, let’s turn our “blind” LLM application into a fully observable workflow with Langfuse! The @observe decorator from the Langfuse SDK is a powerful, super clean way to add tracing with hardly any code changes.
We’ll take our basic_llm_app.py and supercharge it with Langfuse tracing:
# src/tracing_decorator.py
import os
import time
from langfuse.decorators import observe, langfuse_context
from llm_utils import get_llm_client
from config import get_llm_config, get_langfuse_config

# Display Langfuse configuration for quick verification
print("\n" + "="*70)
print("🔧 LANGFUSE CONFIGURATION")
print("="*70)
print(f"📍 LANGFUSE_HOST: {os.getenv('LANGFUSE_HOST', 'NOT SET')}")
print(f"🔑 LANGFUSE_PUBLIC_KEY: {os.getenv('LANGFUSE_PUBLIC_KEY', 'NOT SET')[:20]}...")
print(f"🔐 LANGFUSE_SECRET_KEY: {os.getenv('LANGFUSE_SECRET_KEY', 'NOT SET')[:20]}...")
print("="*70 + "\n")

# Initialize vLLM client
client, model = get_llm_client(load_model_from_config=True)
langfuse_host = get_langfuse_config().get("host", "http://localhost:3000")

@observe(name="generate_answer")
def generate_answer(question: str) -> str:
    """Generate answer using vLLM with Langfuse tracing."""
    llm_config = get_llm_config()
    temperature = llm_config.get("temperature", 0.7)
    max_tokens = llm_config.get("max_tokens", 300)

    # Record initial inputs to the observation (span)
    langfuse_context.update_current_observation(
        input={"question": question, "model": model, "temperature": temperature, "max_tokens": max_tokens}
    )

    start_time = time.time()
    try:
        response = client.chat.completions.create(
            model=model,
            messages=[
                {"role": "system", "content": "You are a helpful assistant."},
                {"role": "user", "content": question}
            ],
            temperature=temperature,
            max_tokens=max_tokens
        )
        latency_ms = (time.time() - start_time) * 1000
        answer = response.choices[0].message.content

        # Update the observation with outputs, token usage, and metadata
        langfuse_context.update_current_observation(
            output={"answer": answer},
            usage={
                "input": response.usage.prompt_tokens,
                "output": response.usage.completion_tokens,
                "total": response.usage.total_tokens
            },
            metadata={"latency_ms": round(latency_ms, 2)}
        )

        print(f"📊 Latency: {latency_ms:.2f}ms")
        print(f"📊 Tokens: {response.usage.prompt_tokens} → {response.usage.completion_tokens} (total: {response.usage.total_tokens})")

        return answer
    except Exception as e:
        print(f"Error during LLM generation: {e}")
        # Log the error to Langfuse
        langfuse_context.update_current_observation(status_message=str(e), level="ERROR")
        raise

@observe(name="llm_pipeline")
def run_pipeline(question: str):
    """Simple pipeline with Langfuse tracing."""
    print(f"\n{'='*50}")
    print(f"Question: {question}")
    print(f"{'='*50}\n")

    # Update the parent trace metadata
    langfuse_context.update_current_trace(
        name="decorator_pipeline_run",
        metadata={"method": "decorator_example"}
    )

    print("Generating answer with tracing...")
    answer = generate_answer(question) # This automatically becomes a child span

    trace_id = langfuse_context.get_current_trace_id()
    print(f"🔍 View trace: {langfuse_host}/trace/{trace_id}")

    print(f"✅ Answer:\n{answer}\n")
    print(f"{'='*50}\n")

if __name__ == "__main__":
    question = "Explain neural networks briefly."
    run_pipeline(question)

    # Crucial for ensuring all traces are sent before the script exits
    print("⏳ Flushing traces to Langfuse...")
    langfuse_context.flush()
    print("✅ Traces sent!\n")
How the @observe Decorator Works
- Automatic Tracing: Just pop
@observe(name="generate_answer")above yourgenerate_answerfunction. Langfuse then automatically creates a new “observation” (a span) every time that function runs, capturing start/end times and linking it into a trace. - Parent-Child Spans: When
run_pipeline(also@observe-decorated) callsgenerate_answer, Langfuse automatically knows they’re related.run_pipelinebecomes the “parent trace,” andgenerate_answerbecomes a “child span,” creating a clear hierarchy in the Langfuse UI. - Logging Inputs and Outputs: With
langfuse_context.update_current_observation(), you explicitly log the exact prompt, model parameters, LLM response, and even the calculated latency to the current span. - Token Usage: Super important: we pull out
prompt_tokens,completion_tokens, andtotal_tokensfrom thevLLMresponse and log them to Langfuse. This is golden for cost analysis and prompt efficiency. - Error Handling: If something goes wrong, the
exceptblock can update the current observation in Langfuse with anERRORstatus. This gives you instant visibility into failures right in your dashboard. - Direct Links: The script prints a handy clickable URL directly to the trace in your local Langfuse UI (like
http://localhost:3000/trace/...). This makes it super easy to jump straight to the details of a specific run. - Flushing Traces: For scripts that run quickly,
langfuse_context.flush()is key. It makes sure all pending trace data gets sent to the Langfuse server before your script ends, so you don’t miss any traces.
This decorator-based approach makes adding full observability to your LLM applications incredibly simple. It transforms those previously opaque operations into a transparent, totally debuggable workflow.
Running and Verifying Your Observability Stack
Okay, all components are set up, and your LLM application is wired with Langfuse! Time to bring everything online and see your first real traces in action!
1. Start Your Self-Hosted Stack
First, double-check that all your Docker services are up and running:
docker compose --profile gpu up -d
# Or for CPU:
# docker compose --profile cpu up -d
Confirm they’re all healthy:
docker compose ps
You should see langfuse-server, langfuse-worker, langfuse-postgres, and vllm-server all showing healthy or running. If langfuse-worker isn’t running, your dashboards will look empty even if traces are being sent. And if vllm-server isn’t healthy, your LLM calls won’t work.
2. Verify Individual Components
- Langfuse UI: Open
http://localhost:3000in your browser. You should see the Langfuse dashboard. - vLLM Server: Check its health at
http://localhost:8000/health. You should see{"status": "ok"}.
3. Run Your First Traced Pipeline
Now, run your instrumented Python script:
python src/tracing_decorator.py
In your terminal, you should see something like this:
==================================================
Question: Explain neural networks briefly.
==================================================

Generating answer with tracing...
📊 Latency: 312.45ms
📊 Tokens: 12 → 88 (total: 100)
🔍 View trace: http://localhost:3000/trace/01HXFG...
✅ Answer:
A neural network is a computational model inspired by the structure...
==================================================

⏳ Flushing traces to Langfuse...
✅ Traces sent!
This output confirms:
- Your LLM call worked.
- Langfuse captured latency and token usage.
- A unique trace ID was generated.
- The trace data was successfully sent to your self-hosted Langfuse server.
4. View the Trace in Langfuse
Click the View trace URL from your terminal (e.g., http://localhost:3000/trace/01HXFG...).
You’ll be taken straight to the Langfuse dashboard, where you can explore:
- The Parent Trace:
decorator_pipeline_run, showing the overall execution. - The Nested Span:
generate_answer, detailing the specific LLM call. - Full Metadata: See the exact
question, model,temperature,max_tokens, the LLM’s fullanswer, and the calculatedlatency_ms. - Token Usage: Clearly see input, output, and total tokens used.
- Timeline View: Visualize the sequence and duration of each step.
This real-time, detailed view gives you the transparency you need to understand, debug, and optimize your LLM applications. Your observability stack is now live, delivering actionable insights!
Why LLM Observability Matters for Your AI Projects
Adding LLM observability with tools like Langfuse isn’t just a nice bonus; it’s absolutely essential for building robust, cost-effective, and reliable AI applications.
- Faster Debugging: Instantly pinpoint issues like hallucinations, weird token counts, or slow responses by checking detailed traces, instead of wading through vague logs.
- Performance Optimization: Find bottlenecks in your LLM pipelines, whether it’s slow model inference, pricey retrieval steps, or clunky prompt construction.
- Cost Control: Keep an eye on token usage per request and across your app to manage API costs and optimize for efficiency.
- Improved User Experience: Catch and fix subtle LLM issues before they annoy your users.
- Enhanced Evaluation: Set yourself up for quantitative evaluation by capturing all data needed for scoring and A/B testing different prompts or models.
- Transparency and Trust: Understand how your AI system gets its answers, boosting confidence and making it easier to explain.
- Scalability: As your LLM app grows, observability gives you the metrics and insights to scale without losing control.
Basically, LLM observability transforms your entire development process. You’ll build better AI applications with way more confidence and efficiency.
Frequently Asked Questions (FAQ)
What is LLM Observability?
It’s about understanding what’s happening inside your LLM applications. By collecting and visualizing data like traces, logs, and metrics, you get insights into prompts, outputs, latency, token usage, and the flow of multi-step AI pipelines.
Why can’t I just use print statements to debug my LLM app?
Print statements are basic. They’re unstructured and get messy fast in complex LLM apps. They can’t give you hierarchical views, aggregated metrics, run comparisons, or the real-time, searchable dashboards that platforms like Langfuse offer.
Is Langfuse only for self-hosting?
No, Langfuse has both a self-hosted option (which we used here for local development benefits) and a cloud-hosted version. The cloud version is often preferred for production if you’d rather not manage infrastructure.
What is vLLM and why use it here?
vLLM is an open-source library for super fast, low-latency LLM inference. We use it to run a local LLM (like Llama 2) with an OpenAI-compatible API. This lets us test and develop our LLM app and observability stack quickly and locally, without needing external cloud APIs.
What’s the difference between a trace and a span in Langfuse?
A trace is an entire end-to-end operation or workflow (like handling a user query). A span is a smaller, individual operation within that trace (like a single LLM call or a retrieval step). Spans can be nested, forming a hierarchical view within a trace.
Do I always need the Langfuse Worker?
Yes, if you want the Langfuse dashboard’s full analytics, charts, and aggregated views, the Langfuse Worker is a must. It processes the raw trace data from the server into the formats needed for these visuals.
Final Thoughts
Moving your LLM application from a “black box” to a fully transparent, observable system is a huge leap for any developer. By setting up your own self-hosted Langfuse and vLLM stack, you’ve now got the tools to demystify LLM behavior, spot performance issues, control costs, and ultimately build more reliable, efficient AI solutions.
This guide gave you the groundwork and practical steps to jumpstart your LLM observability journey. In future posts, we’ll dive deeper into advanced tracing, evaluation metrics, and how to use these insights to continuously improve your AI applications.
Ready to master your LLM development skills? Check out more guides and resources on optimizing AI pipelines, prompt engineering, and advanced machine learning techniques right here on our platform.